
How to Use Benchmarking Data

A guide for how to properly use benchmarking data to inform your compensation program.
Our mission is to empower businesses, researchers, and investors with the most accurate, comprehensive, and real-time market data tailored specifically for the biotechnology sector. In an industry where data drives discovery and strategic decisions, we provide a robust software solution that streamlines the process of acquiring, analyzing, and leveraging critical market insights.
Table of Contents
- Understanding Compensation Benchmarking Datasets
- Aggregate Data
- Organizing Data
- Verifying Data
- Calculating Data
- What Not to Do
- Best Practices on Using Benchmarking Data
Introduction
Understanding market rates is a critical aspect for developing an effective compensation program — especially since compensation is constantly changing, now more than ever.
To answer “What is the market rate for this role?” accurately, one needs a lot more information.
Factors such as location, industry, company stage, and proficiency level are necessary to pinpoint what similar companies are paying for this role.
Perhaps the most frustrating part is the difficult realization that no dataset is perfect, and thus none can be entirely relied on without careful consideration.
This guide will show you how to use benchmarking data, best practices to adopt, and pitfalls to avoid.
Understanding Compensation Benchmarking Datasets
Before We Start
Benchmarking datasets are not perfect
They’re a sample size of the market and thus very sensitive to the number of datapoints.
They're also sensitive to proper job matching (assigning an employee to the right job in the dataset’s set of jobs).
Benchmarking datasets must be interpreted properly
Market data should inform, not dictate, your compensation decisions.
Best practice is to interpret what the data says, and make decisions that work for your organization.
There are important tradeoffs between specificity and accuracy
More specificity (i.e., applying more filters) means less available data points, thus oftentimes lower accuracy.
You must navigate these carefully.
An Overview of Benchmarking
Nearly all market datasets are developed with the same four-step process:
Aggregate data
Providers aggregate compensation data from contributors, which are usually companies (but not always).
Verify data
Providers verify data to ensure it is accurate and relevant.
Categorize data
Providers then organize and categorize data by various factors, usually at the company and job levels.
Calculate results
Providers run calculations over the data and deliver statistical calculations as the results, sometimes with filters to increased specificity.
Aggregate Data
Who provides the data?
Usually, providers aggregate data from companies (aka employers).
Why? Employers are generally best-positioned to provide accurate data, with more context, and in higher volume. Plus, they tend to be willing to spend more resources contributing data and purchasing results.
But not all datasets are based on employer-submitted data. Some are based on employee-level data (e.g., Glassdoor, Levels.fyi).
Regardless of who providers the data, benchmarking datasets have the same objective: collect enough relevant data to create results of statistically significant enough to be valuable to those consuming the data.
How is data aggregated?
Traditionally, data has been collected via surveys that ask for context beyond the annual salary for each employee.
These surveys are often manual, and some can be quite extensive and painful.
Lengthy surveys that are hard to fill out can place a burden on contributors, which decrease participation rates and introduce the risk of human error.
More recently, emerging providers have begun aggregating data directly from systems such as payroll providers, cap tables, and applicant tracking systems, aiming to increase data quality and reduce the burden on contributors.
Organizing Data
Grouping generally exists at two levels
Company-level
Often organized by several factors such as:
- Industry
- Company size (e.g., number of employees, valuation, revenue, capital raised)
- Stage
- Location
Organizing Data
Often organized by several factors, at least:
- Function
- Job Family
- Proficiency level
Organizing data by job-level information is usually the most difficult part, and where issues often arise.
Organizing data at the job level is generally done through job matching, which is notoriously difficult to get right.
The challenge is that neither contributors nor dataset providers have enough context to do job matching alone.
Contributors often lack the expertise and knowledge on how to do proper job matching, especially when seeing new and changing job catalogues.
On the other hand, dataset providers lack enough context about each employee to do proper job matching alone.
As a result, collaboration between contributors and dataset providers is often required, as is careful verification.
Verifying Data
As the saying goes “garbage in, garbage out”.
Without careful verification, dataset providers run the risk of collecting insufficient data, or doing improper job matching, thus negatively impacting results.
How dataset providers verify submission can vary from manual inspection and collaboration with contributors, to AI-assisted verification.
The former is the more traditional approach used by traditional providers like Radford (owned by Aon). The latter is more common with emerging, tech-forward dataset providers.
Calculating Data
It is critical to understand what results from dataset providers are and are not.
Results are statistical distributions of a sample size that represents a subset (often a small one) of the market.
Results are not perfect — they do not have complete coverage and may lack sufficient results to be statistically significant, especially as more filters are applied. The greater the specificity, the smaller the sample size, and thus lower accuracy.
What do the results look like?
It depends! The way results are displayed and reported varies by provider.
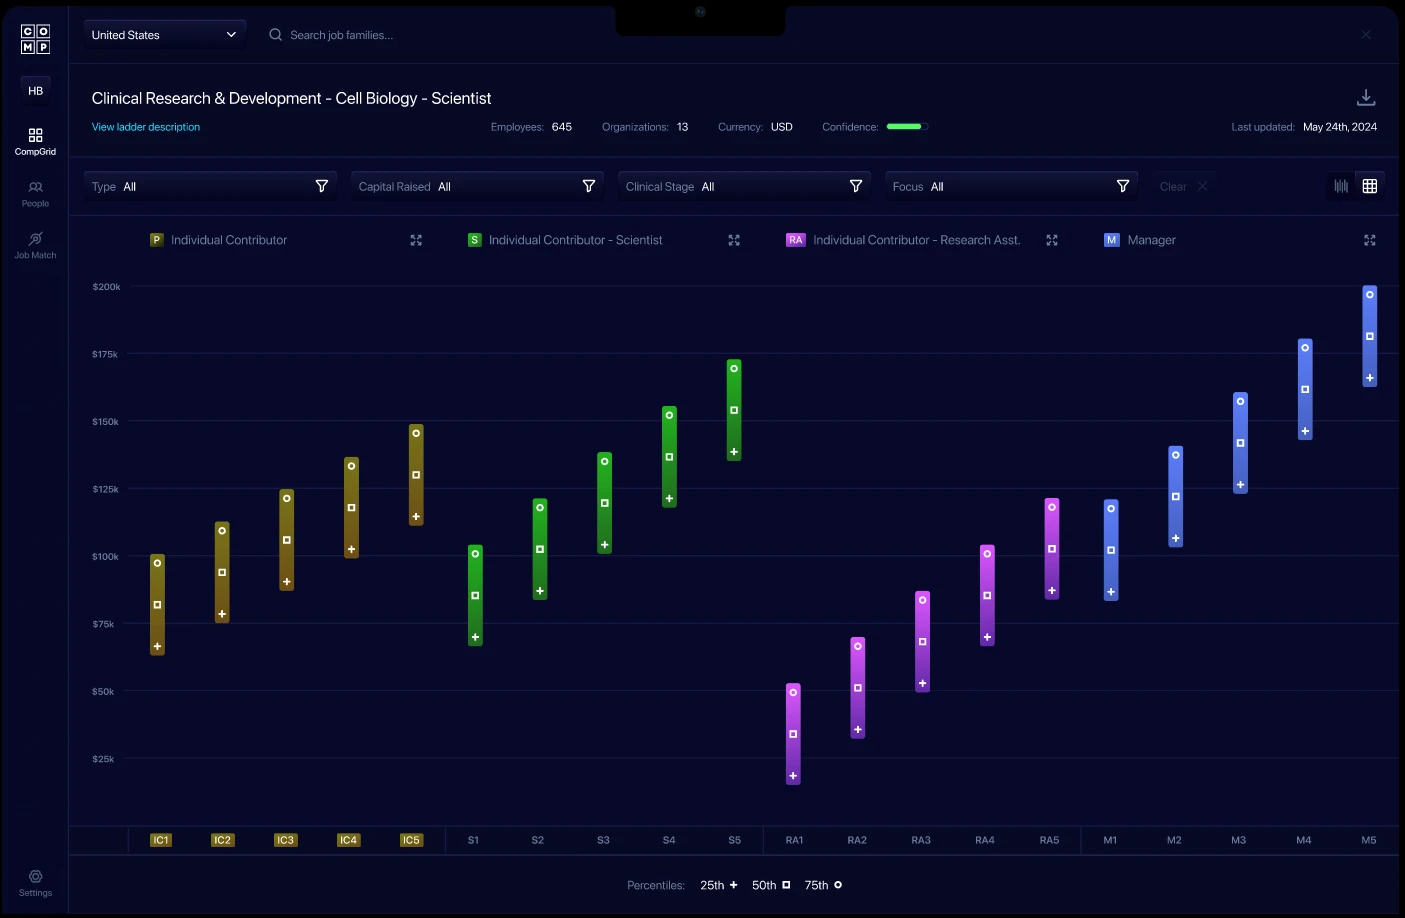
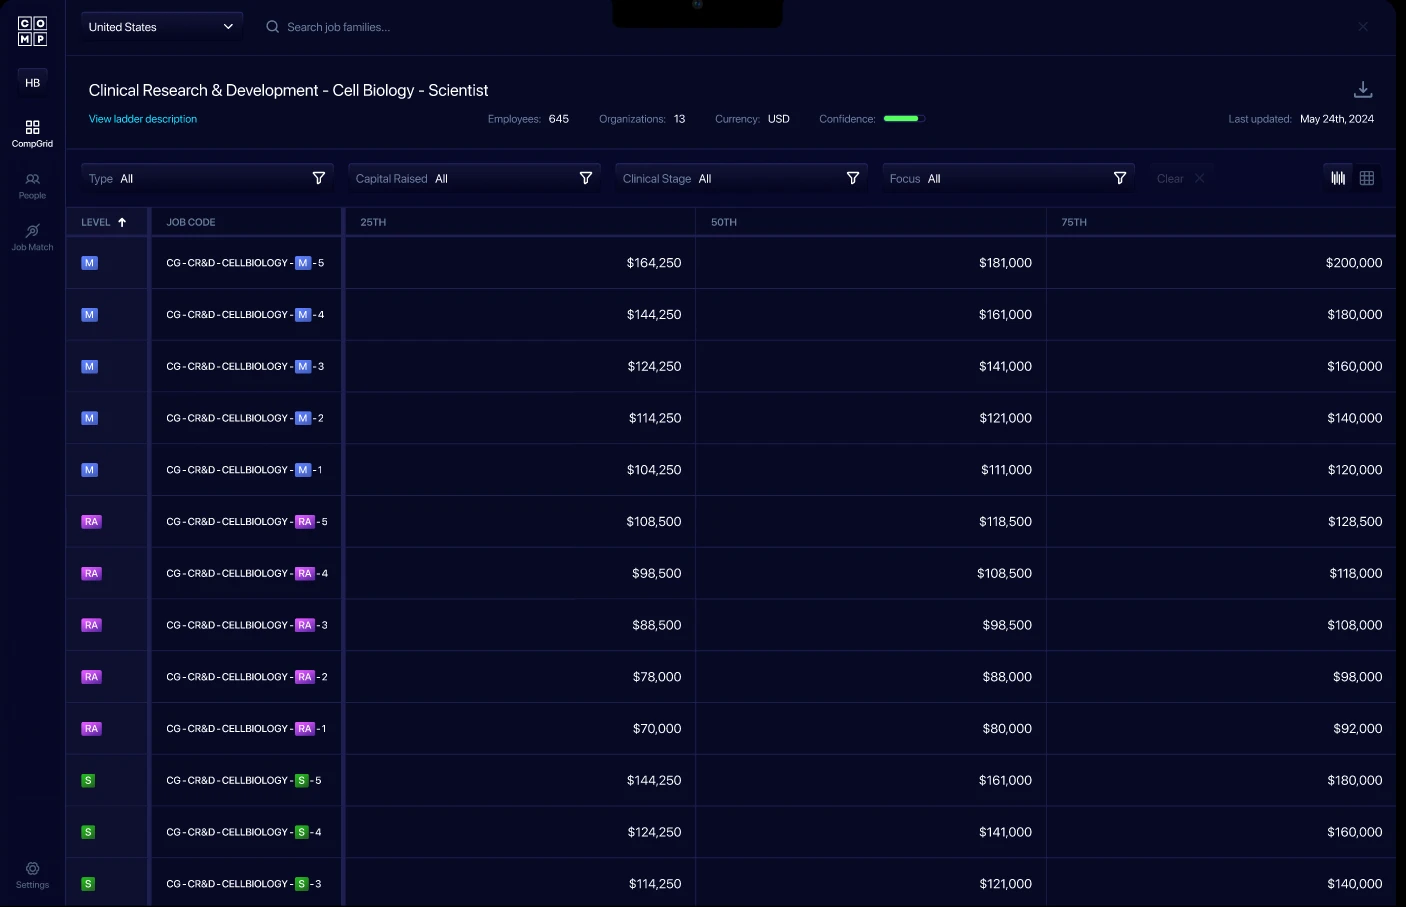
Generally, results are shown as ranges — typically shown as percentiles.
The next pages show a few examples of how different providers report their results.
Note: a common challenge for companies is learning how to interpret results. We’ll cover that in more detail later in this guide.
Illustrative Benchmarking Results
What NOT to Do
Don’t use market percentiles as your own bands
Why not?
Market percentiles are statistical distributions based on the underlying data.
That means widths will vary widely across the dataset — even within the same career ladder or job family
Why is this bad?
Using these percentiles as bands may lead to:
- Pay inequities
- Inconsistent decisions
- Difficulty recruiting, rewarding, and retaining employees
- Challenges communicating compensation decisions
- Higher sensitivity to dataset changes
- Decreased trust in your program
Don’t apply too many company-level filters (unless there’s sufficient data)
Why not?
While applying filters increases specificity, it also reduces the number of datapoints that match that criteria.
For example, filtering for Software Engineers in Denver, CO at Series A companies in Biotech with <100 employees and $1-10M in revenue will likely return very few results.
Why is this bad?
Without sufficient data, benchmarking results may be:
- Incomplete (missing data for some levels or even entire job families)
- Insufficient (too few data points)
- Misleading (return results that are vastly different than the actual market rates)
Don’t share benchmarking data externally without proper context
Why not?
Without properly understanding how benchmarking datasets work, a person can reach the wrong conclusions and use the data incorrectly.
Why is this bad?
Sharing market benchmarks without proper context can create more issues than it solves, including:
- Create misconception that benchmark data is perfect
- Create more questions than answers
- Erode trust in benchmarks, your program, and you
- Anchor people to the wrong benchmark or rate for a role
These are just a few, but there are more. It’s important not to share benchmarking data alone — always provide proper context.
Best Practices on Using Benchmarking Data
Define your compensation philosophy
Why?
We strongly advise that you define your company’s compensation philosophy.
Your philosophy will serve as the blueprint behind your compensation decisions — from which market dataset(s) you use, to how you will interpret data to inform your compensation program, and how you will make and communicate compensation decisions.
How?
To learn how to write your compensation philosophy, you can read our guide.
Build your own compensation bands
Why?
Building your own compensation bands puts you in control.
It gives you the flexibility to use market data correctly — to adopt it with confidence when data is strong, and deviate when data is weak (or non-existent).
How?
Using your compensation philosophy, define the “market reference point(s)” — the benchmark(s) that will inform your compensation bands.
When using multiple datasets, you can create a composite (e.g., the median or average of the datasets), or you can use all of your market reference points.
By leveraging your compensation philosophy and relevant market data, you can build your own compensation bands.
Then, you can use these to guide how you make and communicate your compensation decisions.
Define and prioritize your requirements from a dataset
Why?
Few companies will find a single dataset that perfectly matches all their requirements. Tradeoffs must often be made.
The best way to make the right decision is by creating a prioritized list of what is most important to your organization from a dataset.
How?
Some questions to consider:
- Which jobs and locations matter most to us?
- Which industries and other company-level information matter most to us?
- What is our budget for data?
- How important is the timeliness of the data?
- Which compensation types do we need benchmarks for?
- How much additional detail do we need?
Then, you can evaluate which dataset works best for your needs.
Then, you can evaluate which dataset works best for your needs.
Why?
No dataset is perfect. If you can get more than one dataset, you will have more data to inform your compensation program.
If your company operates in multiple industries or locations, this may be crucial. Otherwise, you may end up with insufficient, incomplete, or missing data.
Furthermore, seeing different datasets report similar benchmarks increases your confidence that the figures you’re seeing are accurate.
How?
Identify your needs and constraints. Some questions to consider:
- Which jobs and locations matter to us?
- Which industries and other company-level information matter to us?
- What is our budget for data?
Then, you can evaluate which datasets work best for your needs.
Make a move into the future.
Sign up and receive access to cutting-edge tools and real-time market data and ensure your business remains at the forefront of innovation, enabling you to navigate the complexities of the biotech market.